

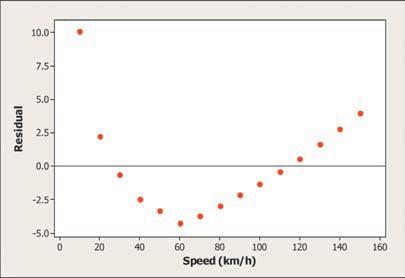
Driving speed and fuel consumption Exercise 9 (page 160) gives data on the fuel consumption y of
Question:
Driving speed and fuel consumption Exercise 9
(page 160) gives data on the fuel consumption y of a car at various speeds x. Fuel consumption is measured in liters of gasoline per 100 kilometers driven and speed is measured in kilometers per hour.
A statistical software package gives the least-squares regression line and the residual plot shown below.
The regression line is y^ = 11.058 − 0.01466x. Would it be appropriate to use the regression line to predict y from x? Justify your answer.
Step by Step Answer:

This question has not been answered yet.
You can Ask your question!
Related Book For 
Question Posted:
