Follow the bouncing ball Students in Mr. Handfords class dropped a kickball beneath a motion detector. The
Question:
Follow the bouncing ball Students in Mr. Handford’s class dropped a kickball beneath a motion detector.
The detector recorded the height of the ball as it bounced up and down several times. Here are the heights of the ball at the highest point on the first five bounces:
Bounce number Height (ft)
1 2.240 2 1.620 3 1.235 4 0.958 5 0.756 Here is a scatterplot of the data:
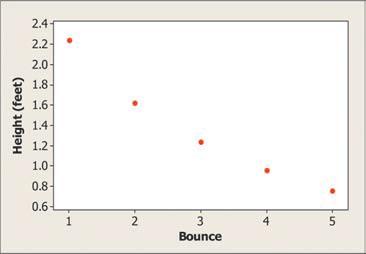
(a) The following graphs show the results of two different transformations of the data. Would an exponential model or a power model provide a better description of the relationship between bounce number and height? Justify your answer.
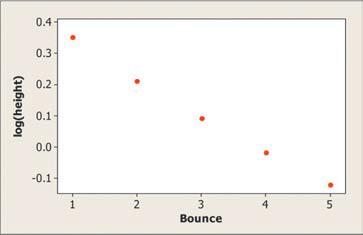
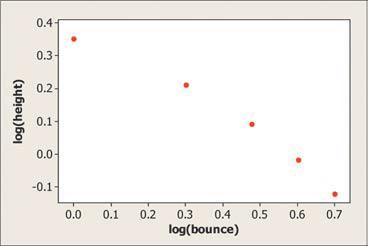
(b) Minitab output from a linear regression analysis on the transformed data of log(height) versus bounce number is shown below. Give the equation of the least-squares regression line. Be sure to define any variables you use.
Predictor Coef SE Coef T P Constant 0.45374 0.01385 32.76 0.000 Bounce -0.117160 0.004176 -28.06 0.000 S = 0.0132043 R-Sq = 99.6% R-Sq(adj) = 99.5%
(c) Use your model from part
(b) to predict the highest point the ball reaches on its seventh bounce. Show your work.
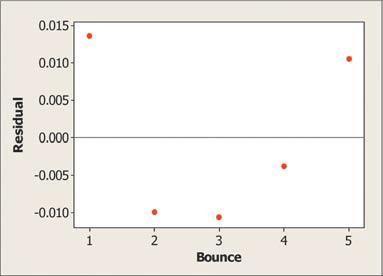
(d) A residual plot for the linear regression in part
(b) is shown on the next page. Do you expect your prediction in part
(c) to be too high, too low, or about right? Justify your answer.
Step by Step Answer:


