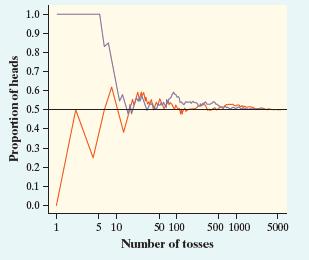
Keep on tossing The figure below shows the results of two different sets of 5000 coin tosses.
Question:
Keep on tossing The figure below shows the results of two different sets of 5000 coin tosses. Explain what this graph says about chance behavior in the short run and the long run.

Step by Step Answer:
Related Book For 

Question Posted:


