

Lets chat (1.1) The bar graph displays data on students responses to the question Which of these
Question:
Let’s chat (1.1) The bar graph displays data on students’ responses to the question “Which of these methods do you most often use to communicate with your friends?”Let’s chat (1.1) The bar graph displays data on students’ responses to the question “Which of these methods do you most often use to communicate with your friends?”
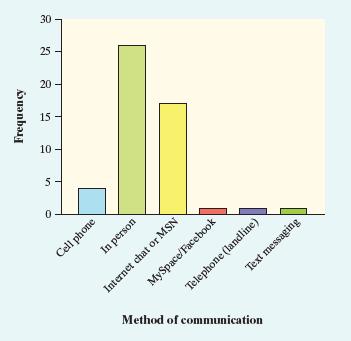
(a) Would it be appropriate to make a pie chart for these data? Why or why not?
(b) Jerry says that he would describe this bar graph as skewed to the right. Explain why Jerry is wrong.
Step by Step Answer:

This question has not been answered yet.
You can Ask your question!
Related Book For 

Question Posted:
