Stats teachers cars A random sample of AP Statistics teachers was asked to report the age (in
Question:
Stats teachers’ cars A random sample of AP® Statistics teachers was asked to report the age (in years)
and mileage of their primary vehicles. A scatterplot of the data is shown at top right.
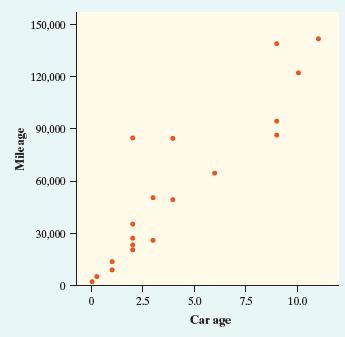 Computer output from a least-squares regression analysis of these data is shown below (df = 19).
Assume that the conditions for regression inference are met.
Variable Coef SE Coef t-ratio prob Constant 7288.54 6591 1.11 0.2826 Car age 11630.6 1249 9.31
(a) Verify that the 95% confidence interval for the slope of the population regression line is (9016.4, 14,244.8).
(b) A national automotive group claims that the typical driver puts 15,000 miles per year on his or her main vehicle. We want to test whether AP® Statistics teachers are typical drivers. Explain why an appropriate pair of hypotheses for this test is H0 : b = 15,000 versus Ha : b ≠ 15,000.
(c) Compute the test statistic and P-value for the test in part (b). What conclusion would you draw at the a = 0.05 significance level?
(d) Does the confidence interval in part
(a) lead to the same conclusion as the test in part (c)? Explain.
Step by Step Answer:

This question has not been answered yet.
You can Ask your question!