Students in a statistics class drew circles of varying diameters and counted how many Cheerios could be
Question:
Students in a statistics class drew circles of varying diameters and counted how many Cheerios could be placed in the circle. The scatterplot shows the results.
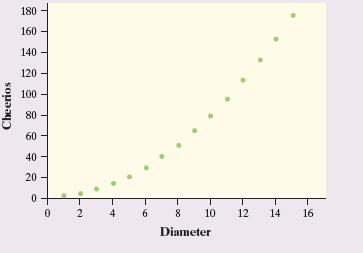
The students want to determine an appropriate equation for the relationship between diameter and the number of Cheerios. The students decide to transform the data to make it appear more linear before computing a leastsquares regression line. Which of the following transformations would be reasonable for them to try?
I. Plot the square root of the number of Cheerios against diameter.
II. Plot the cube of the number of Cheerios against diameter.
III. Plot the log of the number of Cheerios against the log of the diameter.
IV. Plot the number of Cheerios against the log of the diameter.
(a) I and II
(c) II and III
(e) I and IV
(b) I and III
(d) II and IV
Step by Step Answer:

This question has not been answered yet.
You can Ask your question!