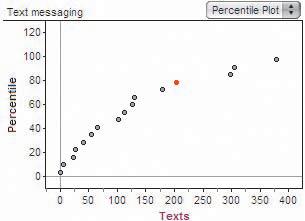
Text me The percentile plot below shows the distribution of text messages sent and received in a
Question:
Text me The percentile plot below shows the distribution of text messages sent and received in a two-day period by a random sample of 16 females from a large high school.
(a) Describe the student represented by the highlighted point.
(b) Use the graph to estimate the median number of texts. Explain your method.

Step by Step Answer:
Related Book For 

Question Posted:


