

The figure below shows a Normal density curve. Which of the following gives the best estimates for
Question:
The figure below shows a Normal density curve.
Which of the following gives the best estimates for the mean and standard deviation of this Normal distribution?
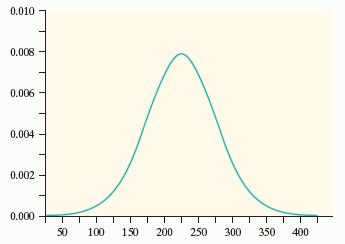
(a) m = 200, s = 50
(d) m = 225, s = 25
(b) m = 200, s = 25
(e) m = 225, s = 275
(c) m = 225, s = 50
Fantastic news! We've Found the answer you've been seeking!
Step by Step Answer:

Answered By
Cristine kanyaa
I possess exceptional research and essay writing skills. I have successfully completed over 5000 projects and the responses are positively overwhelming . I have experience in handling Coursework, Session Long Papers, Manuscripts, Term papers, & Presentations among others. I have access to both physical and online library. this makes me a suitable candidate to tutor clients as I have adequate materials to carry out intensive research.
1538+ Reviews
3254+ Question Solved
Related Book For 
Question Posted:
