Samples of students essays were marked by two tutors independently. The resulting ranks are shown in Table
Question:
Samples of students’ essays were marked by two tutors independently. The resulting ranks are shown in Table 8.7.
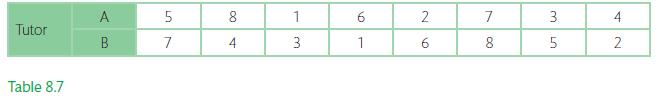
(a) Calculate the rank correlation coefficient.
(b) State any conclusions that you can draw.
Transcribed Image Text:
Tutor Table 8.7 A B 5 7 8 4 1 3 6 1 2 6 7 8 3. 5 4 2
Fantastic news! We've Found the answer you've been seeking!
Step by Step Answer:
Answer rating: 100% (1 review)
To calculate the rank correlation coefficient we can use the formula r 1 6 d2 n n2 1 Where d2 sum of ...View the full answer
Answered By
Susan Juma
I'm available and reachable 24/7. I have high experience in helping students with their assignments, proposals, and dissertations. Most importantly, I'm a professional accountant and I can handle all kinds of accounting and finance problems.
4.40+
15+ Reviews
45+ Question Solved
Related Book For
Question Posted:
Students also viewed these Business questions
-
The author surveyed one of his statistics classes, asking students whether they thought it was more important to improve college students success rates or to address climate change. The students...
-
Two investment counselors have evaluated the 15 major companies in an industry according to their potential as a safe investment. Both counselors agree that company C is the best firm in which to...
-
The music preferences of students in one of the authors statistics classes are shown in Table 8. a. Use technology with seed 95 to randomly select 6 students without replacement. b. For the simple...
-
A closely wound solenoid of 2000 turns and area of cross-section 1.5 x 10 mcarries a current of 2.0 A. It suspended through its centre and perpendicular to its length, allowing it to turn in a...
-
What is a joint venture, and how can a joint venture be a form of off-balance-sheet financing?
-
What are factors you should consider when preparing your contact information?
-
What is a verified pleading?
-
An accountant wishes to predict direct labor cost (y) on the basis of the batch size (x) of a product produced in a job shop. Data for 12 production runs are given in Table 13.5, along with the Excel...
-
Manufacturing, Inc., reported the following at December 3 1 , 2 0 1 8 , and December 3 1 , 2 0 1 9 : LOADING... ( Click the icon to view the data. ) Lakeshore Manufacturing has paid all preferred...
-
In the regression equation for y = b 0 + b 1 x, the value of b 0 is given by the equation: . bo = C. boi -b, n -b, n . bo D. bo = -, 20 - n
-
Construct a scatter plot for the data in Table 8.4 and calculate Pearsons correlation coefficient, r. Comment on the strength of the correlation between x and y. X: y: Table 8.4 40 32 41 43 40 28 42...
-
Describes two processes of project portfolio management, prioritizing and selecting projects and managing the projects once they are in the portfolio?
-
Construct a frequency distribution with 5 classes by filling in the boxes below. Heights of a Rural Middle School's Eight Graders in inches Height Midpoint Frequency Relative Frequency The following...
-
Briefly present the main components of Polanyi's environmental sociology/argument . What is the importance of each component of this to environmental sociology?
-
Summary of Preface "An Introduction to Environmental Sociology" in Twenty Lessons in Environmental Sociology ? What do you understand by the term environmental sociology? b) State five importance...
-
Cleaning supplies Electricity Maintenance Wages and salaries Depreciation Rent Administrative expenses per Month Fixed Cost Cost per Car Washed $ 0.80 $ 1,200 $ 0.15 $ 0.20 $ 5,000 $ 0.30 $ 6,000 $...
-
(a) Advanced Computer Sdn Bhd is involved in the manufacturing of computer network equipment. For the next month, the company estimated to make sales of 250 units computer network equipment totaling...
-
The following data were gathered from a randomized block design. Use α = .01 to test for a significant difference in the treatment levels. Establish the hypotheses and reach a...
-
Use this circle graph to answer following Exercises. 1. What fraction of areas maintained by the National Park Service are designated as National Recreation Areas? 2. What fraction of areas...
-
Given the following data, use present worth analysis to find the best alternative, A, B, or C Use an analysis period of 1.2 years and 10% interest. Initial cost Annual benefit Salvage value $12,00...
-
Consider the following four alternatives. Three are "do something" and one is "do nothing At the end of the 5-year useful life of B, a replacement is not made. If a 10-year analysis period and a 10%...
-
A cost analysis is to be made to determine what, if anything should be done in a situation offering three "do-something" and one "do-nothing" alternatives. Estimates of the cost and benefits are as...
-
1. After opening Rockwood Mortality & Cost.xlsx , click on the Data tab near the top of the screen and select Data Analysis. 2. You will see the option for three different t-tests. 3. Excel does not...
-
A firm's short-run cost function is c(q) = q + 6q +3. (a) Derive the AC, AVC, and MC, and draw them on the same graph. (b) Compute the firm's short-run supply function s(p). (c) What is the firm's...
-
Should decision control and decision management be separate or together? Provide a provide a fictitious example or a real-world example of a firm where the control (correctly) resides with the same...
Study smarter with the SolutionInn App