Cattle, being ruminants, have multiple chambers in their stomachs. Stimulating speci c receptors causes re ex contraction
Question:
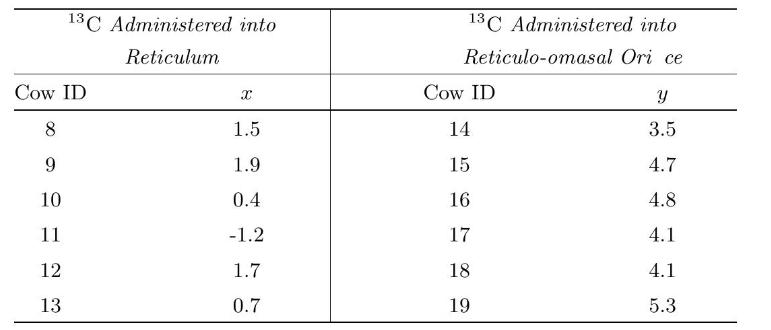
Cattle, being ruminants, have multiple chambers in their stomachs. Stimulating speci c receptors causes re ex contraction of the reticular groove and swallowed uid then bypasses the reticulo-rumen and moves directly to the abomasum. Scientists wanted to develop a simple nonradioactive, noninvasive test to determine when this occurs. In a study to determine the fate of swallowed uids in cattle, McLeay et al. (1997) investigate a carbon-13 \(\left({ }^{13} \mathrm{C}\right)\) octanoic acid breath test as a means of detecting a reticular groove contraction in cattle. Twelve adult cows were randomly assigned to two groups of 6 cows. The rst group had \(200 \mathrm{mg}\) of \({ }^{13} \mathrm{C}\) octanoic acid administered into the reticulum, and the second group had the same dose of \({ }^{13} \mathrm{C}\) octanoic acid administered into the reticulo-osmasal ori ce. Change in the enrichment of \({ }^{13} \mathrm{C}\) in breath was measured for each cow 10 minutes later. The results are:

(a) Explain why the observations of variables \(x\) and \(y\) can be considered independent in this experiment.
(b) Suppose the change in the enrichment of \({ }^{13} \mathrm{C}\) for cows administered in the reticulum is normal \(\left(\begin{array}{ll}1 & 2 \\ 1\end{array}\right)\), where \({ }_{1}^{2}=100^{2}\). Use a emphnormal( \(\left.22^{2}\right)\) prior for \({ }_{1}\). Calculate the posterior distribution of \({ }_{1} x_{8} \quad x_{13}\).
(c) Suppose the change in the enrichment of \({ }^{13} \mathrm{C}\) for cows administered in the reticulo-omasal ori ce is normal \(\left(\begin{array}{ll}2 & 2 \\ 2\end{array}\right)\), where \({ }_{2}^{2}=140^{2}\). Use a normal \(\left(22^{2}\right)\) prior for 2 . Calculate the posterior distribution of \(1 y_{14} \quad y_{19}\).
(d) Calculate the posterior distribution of \({ }_{d}=1_{2}{ }_{2}\), the di erence between the means.
(e) Calculate a 95\% Bayesian credible interval for \(d\).
(f) Test the hypothesis
\[
H_{0}: \quad 1 \quad 2=0 \text { versus } \quad H_{1}: \quad 1 \quad 2=0
\]
at the \(5 \%\) level of signi cance. What conclusion can be drawn.
Step by Step Answer:

Introduction To Bayesian Statistics
ISBN: 9781118091562
3rd Edition
Authors: William M. Bolstad, James M. Curran


