

Question: Develop a table of row percentages for the contingency table you set up in Exercise 2.74. Using these row percentages, construct a percentage frequency distribution
Develop a table of row percentages for the contingency table you set up in Exercise 2.74. Using these row percentages, construct a percentage frequency distribution of overall mechanical quality rating for each of the United States, the Pacific Rim, and Europe. Illustrate these three frequency distributions using percent bar charts and compare the distributions in a written report.
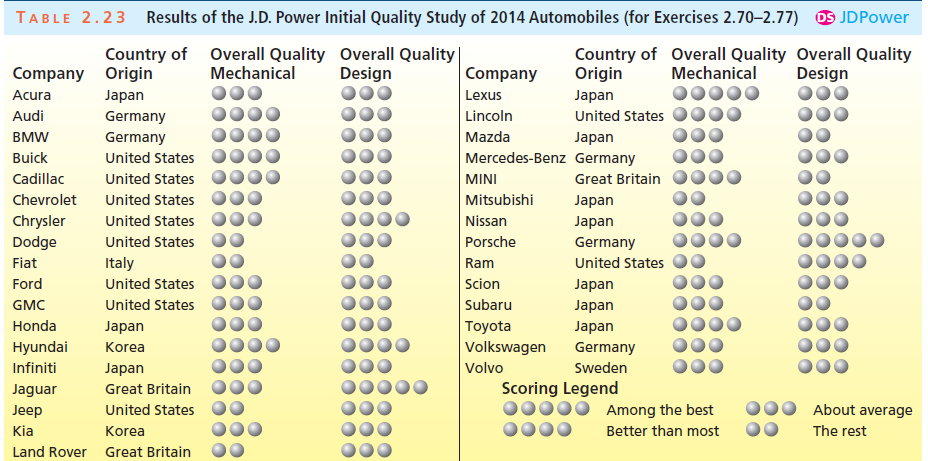
Based on the data in Table 2.23 (see page 100). This table gives the results of the J.D. Power initial quality study of 2014 automobiles. Each model is rated on overall mechanical quality and overall design quality on a scale from “among the best” to “the rest” (see the Scoring Legend).
Step by Step Solution
There are 3 Steps involved in it

Get step-by-step solutions from verified subject matter experts