

Question: Stop-One.com, a large Internet retailer, is studying the lead time (elapsed time between when an order is placed and when it is filled) for a
Stop-One.com, a large Internet retailer, is studying the lead time (elapsed time between when an order is placed and when it is filled) for a sample of recent orders. The lead times are reported in days.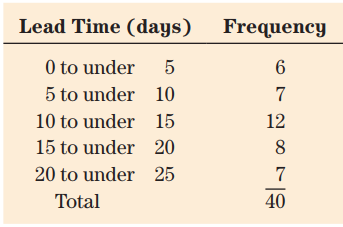
a.?How many orders were studied?b.?What is the midpoint of the first class?c.?What are the coordinates of the first class for a frequency polygon?d.?Draw a histogram.e.?Draw a frequency polygon.f. Interpret the lead times using the two charts.
Lead Time (days) Frequency 0 to under 10 5 to under 7 15 10 to under 12 15 to under 20 7 20 to under 25 Total 40
Step by Step Solution
3.41 Rating (164 Votes )
There are 3 Steps involved in it
a 40 b 25 c 25 6 always draw a frequency ... View full answer

Get step-by-step solutions from verified subject matter experts