

Question: The table shows monthly ABS data for approvals for residential buildings in South Australia for the period January 2017 to June 2020. Estimate the data
The table shows monthly ABS data for approvals for residential buildings in South Australia for the period January 2017 to June 2020. Estimate the data using a linear trend model. Forecast the number of building approvals in July 2020.
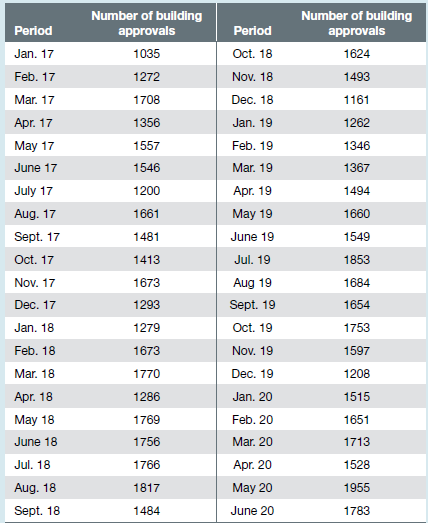
Number of building Number of building approvals approvals Period Period Oct. 18 1035 Jan. 17 1624 1272 Feb. 17 Nov. 18 1493 Mar. 17 1708 Dec. 18 1161 1262 Apr. 17 1356 Jan. 19 May 17 1557 Feb. 19 1346 Mar. 19 1546 June 17 1367 Apr. 19 July 17 1200 1494 Aug. 17 1661 May 19 1660 Sept. 17 1481 June 19 1549 Oct. 17 Jul. 19 1413 1853 Nov. 17 1673 Aug 19 1684 Dec. 17 1293 Sept. 19 1654 Oct. 19 Jan. 18 1279 1753 Feb. 18 1673 Nov. 19 1597 Mar. 18 1770 Dec. 19 1208 1515 Apr. 18 1286 Jan. 20 May 18 1769 Feb. 20 1651 June 18 1756 Mar. 20 1713 Apr. 20 Jul. 18 1766 1528 Aug. 18 1817 May 20 1955 Sept. 18 1484 June 20 1783
Step by Step Solution
3.46 Rating (162 Votes )
There are 3 Steps involved in it
The scatter plot with the trend line shows that housing approvals fluct... View full answer

Get step-by-step solutions from verified subject matter experts