Exercises 4749: The Lorenz curve y = F(r) is used by economists to study income distribution in
Question:
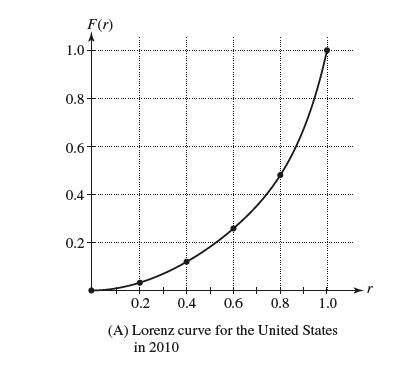
Exercises 47–49: The Lorenz curve y = F(r) is used by economists to study income distribution in a given country (see Figure 15). By definition, F(r) is the fraction of the total income that goes to the bottom rth part of the population, where 0 ≤ r ≤ 1. For example, iƒ F(0.4) = 0.245, then the bottom 40% of households receive 24.5% of the total income. Note that F(0) = 0 and F(1) = 1.


Our goal is to find an interpretation for F'(r). The average income for a group of households is the total income going to the group divided by the number of households in the group. The national average income is A = T/N, where N is the total number of households and T is the total income earned by the entire population.
(a) Show that the average income among households in the bottom rth part is equal to (F(r)/r)A.
(b) Show more generally that the average income of households belonging to an interval [r, r + Δr] is equal to

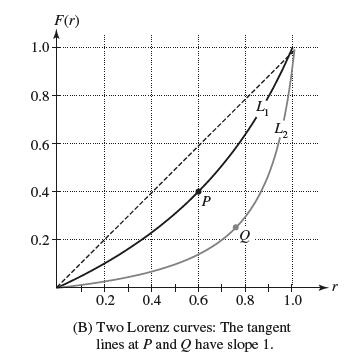
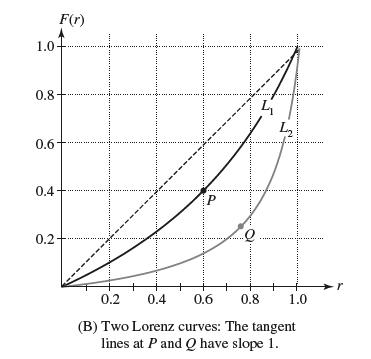
(c) Let 0 ≤ r ≤ 1. A household belongs to the 100rth percentile if its income is greater than or equal to the income of 100r% of all households. Pass to the limit as Δr → 0 in (b) to derive the following interpretation: A household in the 100rth percentile has income F'(r)A. In particular, a household in the 100rth percentile receives more than the national average if F'(r) > 1 and less if F'(r) (d) For the Lorenz curves L1 and L2 in Figure 15(B), what percentage of households have above-average income?

Step by Step Answer:


