

Question: Consider the following function and its power series: a. Let S n (x) be the sum of the first n terms of the series. With
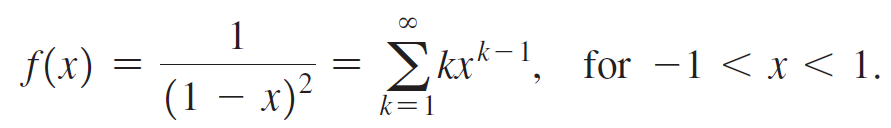
Consider the following function and its power series:
a. Let Sn(x) be the sum of the first n terms of the series. With n = 5 and n = 10, graph f(x) and Sn(x) at the sample points x = -0.9, -0.8, . . , -0.1, 0, 0.1, . . , 0.8, 0.9 (two graphs). Where is the difference in the graphs the greatest?
b. What value of n is needed to guarantee that |f(x) - Sn(x) |< 0.01 at all of the sample points?
1 Skx*-1, for 1 < x < 1. f(x) (1 x) k=1 ||
Step by Step Solution
3.35 Rating (173 Votes )
There are 3 Steps involved in it
For both graphs the difference between the true value and the estimate is greate... View full answer

Get step-by-step solutions from verified subject matter experts