

Question: Graph the following equations. Then use arrows and labeled points to indicate how the curve is generated as u increases from 0 to 2. 1
Graph the following equations. Then use arrows and labeled points to indicate how the curve is generated as u increases from 0 to 2π.
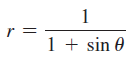
1 + sin 0
Step by Step Solution
★★★★★
3.53 Rating (156 Votes )
There are 3 Steps involved in it
1 Expert Approved Answer
Step: 1 Unlock

The parabola starts at 10 and go... View full answer
Question Has Been Solved by an Expert!
Get step-by-step solutions from verified subject matter experts
Step: 2 Unlock
Step: 3 Unlock