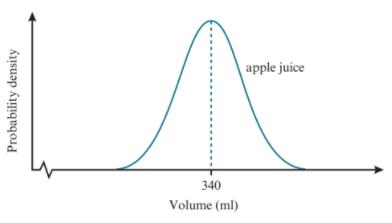
Probability distributions for the quantity of apple juice in 500 apple juice tins and for the quantity
Question:
Probability distributions for the quantity of apple juice in 500 apple juice tins and for the quantity of peach juice in 500 peach juice tins are both represented by normal curves.
The mean quantity of apple juice is 340 ml with variance 4ml2, and the mean quantity of peach juice is 340 ml with standard deviation 4ml.

a. Copy the diagram and sketch onto it the normal curve for the quantity of peach juice in the peach juice tins.
b. Describe the curves’ differences and similarities.
Fantastic news! We've Found the answer you've been seeking!
Step by Step Answer:
Related Book For 

Cambridge International AS & A Level Mathematics Probability & Statistics 1 Coursebook
ISBN: 9781108407304
1st Edition
Authors: Dean Chalmers, Julian Gilbey
Question Posted:


