

Question: For Table 3.7 with scores (0, 0.5, 1.5, 4.0, 7.0) for alcohol consumption. ML fitting of the linear probability model for malformation has output. Interpret
For Table 3.7 with scores (0, 0.5, 1.5, 4.0, 7.0) for alcohol consumption. ML fitting of the linear probability model for malformation has output.
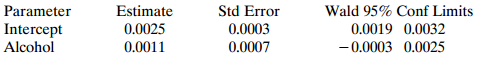
Interpret the model fit. Use it to estimate the relative risk of malformation for alcohol consumption levels 0 and 7.0.
Table 3.7:
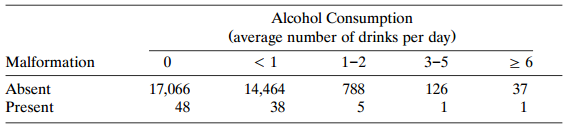
Parameter Intercept Alcohol Wald 95% Conf Limits 0.0019 0.0032 -0.0003 0.0025 Estimate Std Error 0.0003 0.0007 0.0025 0.0011 Alcohol Consumption (average number of drinks per day) 3-5 Malformation 1-2 Absent Present 17,066 48 788 126 37 14,464 38 5 3)
Step by Step Solution
3.28 Rating (169 Votes )
There are 3 Steps involved in it
The estimated probability ... View full answer

Get step-by-step solutions from verified subject matter experts