

Question: Refer to Table 10.8. Based on the reported standardized residuals, explain why the linear-by-linear association model (9.6) might fit well. Fit it and describe the
Refer to Table 10.8. Based on the reported standardized residuals, explain why the linear-by-linear association model (9.6) might fit well. Fit it and describe the association.
Table 10.8:
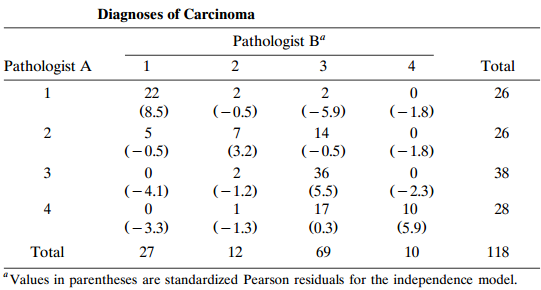
Diagnoses of Carcinoma Pathologist B Pathologist A 4 Total 1 22 26 1 (-5,9) (8.5) (-0.5) (1.8) 5 14 26 (3.2) (-0.5) (-0.5) (-1,8) 3 36 38 (-4.1) (5.5) (-2,3) (-1,2) 4 17 10 28 (-3,3) (-1,3) (0.3) (5.9) Total 27 12 69 10 118 "Values in parentheses are standardized Pearson residuals for the independence model. 2. 2. 2.
Step by Step Solution
3.45 Rating (158 Votes )
There are 3 Steps involved in it
The standardized Pearson residuals are large positive whe... View full answer

Get step-by-step solutions from verified subject matter experts