Table 6.16, based on the 1991 General Social Survey, relates responses on four variables: How often you
Question:
Table 6.16, based on the 1991 General Social Survey, relates responses on four variables: How often you attend religious services (R = At most a few times a year, At least several times a year); Political views (P = Liberal, Moderate,
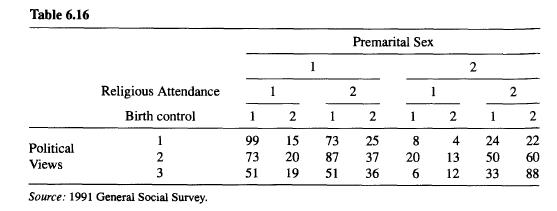
Conservative); Methods of birth control should be available to teenagers be- tween the ages of 14 and 16 (B = Agree, Disagree); Opinion about a man and woman having sex relations before marriage (S = Wrong only sometimes or not wrong at all, Always or almost always wrong).
a. Find a loglinear model that fits these data well.
b. Interpret this model by estimating conditional odds ratios for each pair of variables. Construct and interpret a 90% confidence interval for the true odds ratio relating B and S, controlling for P and R.
c. Consider the logit model predicting (S) using the other variables as main- effect predictors, without any interaction. Fit the corresponding loglinear model. Does it fit adequately? Interpret the effects of the predictors on the response, and compare to results from (b).
Step by Step Answer: