

In the figure shown below, what streams are represented by point A? By point B? How would
Question:
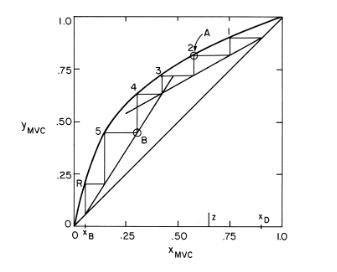
In the figure shown below, what streams are represented by point A? By point B? How would you determine the temperature of stage 2? How about the temperature in the reboiler? If feed composition is as shown, how can the liquid composition on the optimum feed stage be so much less than \(\mathrm{z}\) ?
Fantastic news! We've Found the answer you've been seeking!
Step by Step Answer:

Answered By
Jinah Patricia Padilla
Had an experience as an external auditor in Ernst & Young Philippines and currently a Corporate Accountant in a consultancy company providing manpower to a 5-star hotel in Makati, Philippines, Makati Diamond Residences
120+ Reviews
150+ Question Solved
Related Book For 
Separation Process Engineering Includes Mass Transfer Analysis
ISBN: 9780137468041
5th Edition
Authors: Phillip Wankat
Question Posted:
