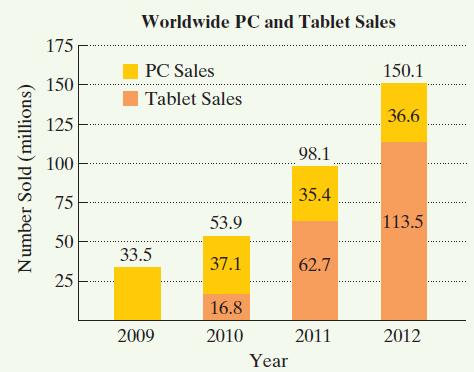
For the period from 2009 through 2012, worldwide PC sales stayed relatively flat, while tablet sales skyrocketed.
Question:
For the period from 2009 through 2012, worldwide PC sales stayed relatively flat, while tablet sales skyrocketed. The bar graph shows worldwide PC and tablet sales, in millions, from 2009 through 2012. The function f(t) = 33.4(1.66)t models worldwide PC and tablet sales combined, f(t), in millions, t years after 2009. When does this model project that 421 million PC and tablets were sold? Round to the nearest year. Based on the relatively flat PC sales over the four years shown by the graph, estimate the number of tablet sales for that year.
Fantastic news! We've Found the answer you've been seeking!
Step by Step Answer:
Related Book For 

Question Posted:


