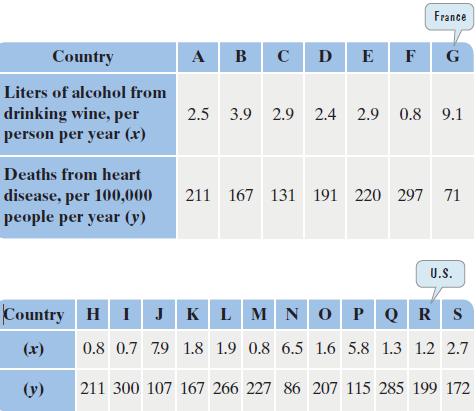
Is there a relationship between wine consumption and deaths from heart disease? The table gives data from
Question:
Is there a relationship between wine consumption and deaths from heart disease? The table gives data from 19 developed countries. a. Use the statistical menu of your graphing utility to enter the 19 ordered pairs of data items shown in the table.b. Use the scatter plot capability to draw a scatter plot of the data.
c. Select the linear regression option. Use your utility to obtain values for a and b for the equation of the regression line, y = ax + b. You may also be given a correlation coefficient, r. Values of r close to 1 indicate that the points can be described by a linear relationship and the regression line has a positive slope. Values of r close to -1 indicate that the points can be described by a linear relationship and the regression line has a negative slope. Values of r close to 0 indicate no linear relationship between the variables. In this case, a linear model does not accurately describe the data.d. Use the appropriate sequence (consult your manual) to graph the regression equation on top of the points in the scatter plot.
Step by Step Answer:


