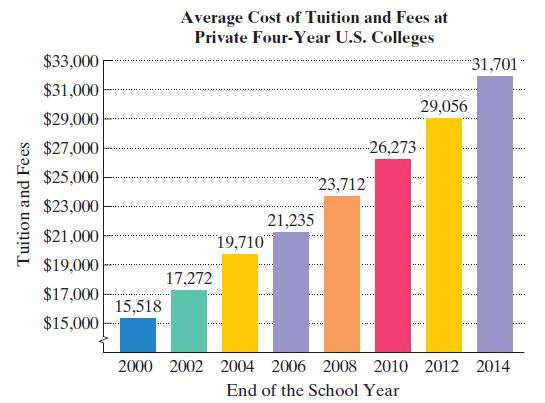
The bar graph shows the average cost of tuition and fees at private four-year colleges in the
Question:
The bar graph shows the average cost of tuition and fees at private four-year colleges in the United States.
The formula![]()
models the average cost of tuition and fees, T, at private U.S. colleges for the school year ending x years after 2000. Use this information to solve Exercises 131–132.
a. Use the formula to find the average cost of tuition and fees at private U.S. colleges for the school year ending in 2012.
b. By how much does the formula underestimate or overestimate the actual cost shown by the graph for the school year ending in 2012?
c. Use the formula to project the average cost of tuition and fees at private U.S. colleges for the school year ending in 2022.
Fantastic news! We've Found the answer you've been seeking!
Step by Step Answer:
Related Book For 

Question Posted:


