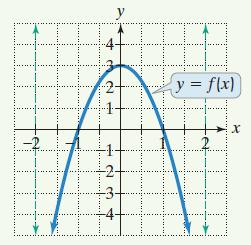
The figure shows the graph of y = f(x) and its two vertical asymptotes. Use the graph
Question:
The figure shows the graph of y = f(x) and its two vertical asymptotes. Use the graph to solve Exercises 1–10.
Find the interval(s) on which f is decreasing.
Transcribed Image Text:
2 I 8996 y = f(x) 0000 X
Fantastic news! We've Found the answer you've been seeking!
Step by Step Answer:
Answer rating: 100% (8 reviews)
f x is ...View the full answer

Answered By

PALASH JHANWAR
I am a Chartered Accountant with AIR 45 in CA - IPCC. I am a Merit Holder ( B.Com ). The following is my educational details.
PLEASE ACCESS MY RESUME FROM THE FOLLOWING LINK: https://drive.google.com/file/d/1hYR1uch-ff6MRC_cDB07K6VqY9kQ3SFL/view?usp=sharing
3.80+
3+ Reviews
10+ Question Solved
Related Book For 

Question Posted:
Students also viewed these Mathematics questions
-
The figure shows a graph of the death rate in automobile accidents and the age of the driver. The numbers came from the Insurance Information Institute. a. Explain what the graph tells us about...
-
The figure shows a graph of electric potential versus position along the x -axis. A proton is originally at point A, moving in the positive x -direction. How much kinetic energy does it need to have...
-
The figure shows a graph of r as a function of θ in Cartesian coordinates. Use it to sketch the corresponding polar curve. 2
-
An assistant treasurer is currently reevaluating their firm's banking relationship. The firm's current lender charges an effective borrowing cost of 4.25 percent. A competing lender provides the...
-
The MidNight Hour, a local nightclub, earned $100,000 in accounting profit last year. This year the owner, who had invested $1 million in the club, decided to close the club. What can you say about...
-
One-year T-bill rates are expected to steadily increase by 150 basis points per year over the next six years. Determine the required interest rate on a three-year T-bond and a six-year T-bond if the...
-
On January 1, 2008, the $2,000,000 par value bonds of Spitz Company with a carrying value of $2,000,000 are converted to 1,000,000 shares of $1.00 par value common stock. Record the entry for the...
-
The following condensed balance sheet is for the partnership of Hardwick, Saunders, and Ferris, who share profits and losses in the ratio of 4:3:3, respectively: The partners decide to liquidate the...
-
On January 1, 2020, Smith Company purchased a cargo van. The firm paid $7,500 cash as a down payment, and signed a noninterest bearing note that required $35,000 to be paid on December 31, 2025. The...
-
In Exercises 18, write the form of the partial fraction decomposition of the rational expression. It is not necessary to solve for the constants. 5x - 6x + 7 (x - 1)(x2 + 1)
-
In Exercises 112, solve each system by the method of your choice. y = 4x - 5 8x - 2y = 10
-
What are the qualities of an opportunity, and why is each quality important?
-
Identify whether the following statements are true or false: a. U.S. GAAP is universally accepted in all countries in the world. b. U.S. GAAP is established by the IASB. c. Once established, U.S....
-
Determine the missing amount in each of the following cases: Assets Liabilities $190,000 $62,000 ? $53,000 $115,000 ? Stockholders' Equity ? $31,000 $61,000
-
For the following four unrelated situations, A through D, calculate the unknown amounts appearing in each column: A B C Beginning Assets. $45,000 $32,000 $53,000 ? Liabilities.. 32,000 15,000 49,000...
-
On December 31, Greg Jones completed his first year as a financial planner. The following data are available from his accounting records: a. Compute Greg's net income for the year just ended using...
-
The Benson Company has collected the following production cost data: {Required:} What would be the incremental production costs for an additional 10 units after the Benson Company has produced 8...
-
Calculate the rent of the increasing annuity. 1. A deposit is made at the end of each month into a savings account paying 1.8% interest compounded monthly. The balance after 1 year is $1681.83. 2....
-
Show that gj concave AHUCQ Abadie For nonnegative variables, we have the following corollary.
-
The formula F = 9/5C + 32 converts a Celsius temperature to Fahrenheit temperature. (a) Find a formula for the inverse. (b) Normally we interchange x and y to find the inverse function. Does it makes...
-
Cars arrive randomly at an intersection with an average rate of 20 cars per hour. The likelihood, or probability, that no car enters the intersection within a period of x minutes can be estimated by...
-
The population of Nevada in millions is given by P(x) = 2.7e 0.014x , where x = 0 corresponds to 2010. (a) Determine symbolically the year when the population of Nevada might be 3 million. (b) Solve...
-
Lou Barlow, a divisional manager for Sage Company, has an opportunity to manufacture and sell one of two new products for a five - year period. His annual pay raises are determined by his division s...
-
Consider a 5 year debt with a 15% coupon rate paid semi-annually, redeemable at Php1,000 par. The bond is selling at 90%. The flotation cost is Php50 per bind. The firm's tax bracket is 30%.
-
A project will generate annual cash flows of $237,600 for each of the next three years, and a cash flow of $274,800 during the fourth year. The initial cost of the project is $749,600. What is the...

Study smarter with the SolutionInn App


