The figure shows the graphs of the cost and revenue functions for a company that manufactures and
Question:
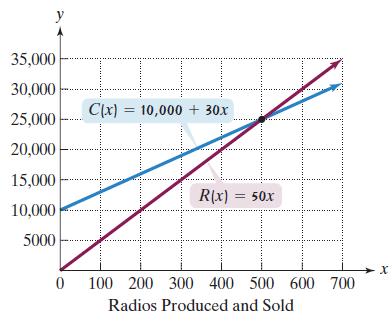
The figure shows the graphs of the cost and revenue functions for a company that manufactures and sells small radios. Use the information in the figure to solve Exercises 55–60.
Use the formulas shown in the voice balloons to find R(200) - C(200). Describe what this means for the company.
Transcribed Image Text:
y 35,000 30,000 25,000 20,000 15,000 10,000 5000 C(x) = 10,000+ 30x R(x) = 50x 0 100 200 300 400 500 600 700 Radios Produced and Sold X
Fantastic news! We've Found the answer you've been seeking!
Step by Step Answer:
Answer rating: 83% (6 reviews)
Rx 50x R200 50 200 10000 Cx1000030x ...View the full answer

Answered By

Utsab mitra
I have the expertise to deliver these subjects to college and higher-level students. The services would involve only solving assignments, homework help, and others.
I have experience in delivering these subjects for the last 6 years on a freelancing basis in different companies around the globe. I am CMA certified and CGMA UK. I have professional experience of 18 years in the industry involved in the manufacturing company and IT implementation experience of over 12 years.
I have delivered this help to students effortlessly, which is essential to give the students a good grade in their studies.
3.50+
2+ Reviews
10+ Question Solved
Related Book For 

Question Posted:
Students also viewed these Mathematics questions
-
The marketing research department for a company that manufactures and sells notebook computers established the following price-demand and revenue functions: p(x) = 2,000 - 60x Price-demand function...
-
The marginal revenue for a company that manufactures and sells .v graphing calculators per week is given by where R(x)is the revenue in dollars. Find the revenue function and the number of...
-
The figure shows graphs of the cost and revenue functions reported by a manufacturer. (a) Identify on the graph the value of for which the profit is maximized. (b) Sketch a graph of the profit...
-
How do digital media change how we relate to others?
-
Stanley, Inc. issues a 15-year $1,000 bond that pays $85 annually. The market price for the bond is $960. The markets required yield to maturity on a comparable-risk bond is 9 percent. a. What is the...
-
Burger Palace Corporation reports a net-cash-used for investing activities of $3.4 million and a net-cash-provided by financing activities of $1.6 million. If cash increased by $1.1 million during...
-
P 15-3 Apply threshold test Ferd CA is a company that has 5 operating segments. Information regarding the operating segments is as follows: A B C D E Sales to unaffiliated customer $500,000 $100,000...
-
Part 1 Modify your program from Learning Journal Unit 7 to read dictionary items from a file and write the inverted dictionary to a file. You will need to decide on the following: How to format each...
-
Ivanhoe Oil Imports is a partnership owned by Magda Robinson and Giannis Garcia. The partners share profit on a 3 : 2 basis, respectively. On January 1 , 2 0 2 4 , they have capital balances of $ 1 1...
-
In Exercises 2762, graph the solution set of each system of inequalities or indicate that the system has no solution. x + y 16 y < 2t 2.
-
Exercises 5860 will help you prepare for the material covered in the next section. Subtract: 3 x - 4 2 x + 2
-
Use Lagrange multipliers to find the maximum or minimum values of f(x, y) subject to the constraint. f(x, y) = x 2 + y, x 2 y 2 = 1
-
Is classroom management something you worry about? If so, you are in good company. Many teachers worry about this topic. The teacher in this video shows many great classroom management strategies....
-
ProForm acquired 60 percent of ClipRite on June 30, 2020, for $780,000 in cash. Based on ClipRite's acquisition-date fair value, an unrecorded intangible of $560,000 was recognized and is being...
-
During 2022, Jason and Vicki Hurting, who are married with two children, had the following tax information. Jason owns a landscaping business, and Vicki works as a sales executive for a manufacturing...
-
Which statement about environmental theory is true? It sees health as a social issue. It is reductionistic It states that there is a specific cause for every disease. It defines solutions in terms of...
-
Tracing Data Analytics Red Flags Back to Source Documents Using Subpoenas 5-1 ANDERSON INTERNAL MEDICINE AND LARSEN CONVENIENCE STORE (CONSPIRACY AND LOAN FRAUD): TRACE TRANSACTIONS DISCOVERED DURING...
-
Insert parentheses where needed so that each expression evaluates to the given number. 1. 7 3 - 4 2; evaluates to 34 2. 2 8 - 20; evaluates to -36
-
For each of the following transactions, indicate whether it increases, decreases, or has no effect on the following financial ratios: current ratio, debt-to-equity ratio, profit margin ratio, and...
-
In Problems 1522, find the principal needed now to get each amount; that is, find the present value. To get $1500 after 2 1/2 years at 1.5% compounded daily.
-
In Problems 1419, solve each equation. Express irrational solutions in exact form. 8 - 2e -x = 4
-
In Problems 1419, solve each equation. Express irrational solutions in exact form. log(x + 9) = 2
-
Palisade Creek Co. is a merchandising business that uses the perpetual inventory system. The account balances for Palisade Creek Co. as of May 1, 2019 (unless otherwise indicated), are as follows:...
-
1-When accounting for an acquisition, goodwill is the difference between what two things? 2- What factors should be considered when deciding whether an acquisition should be financed with cash or...
-
What is the main friction Fluidity aims to address? REAL STATE

Study smarter with the SolutionInn App


