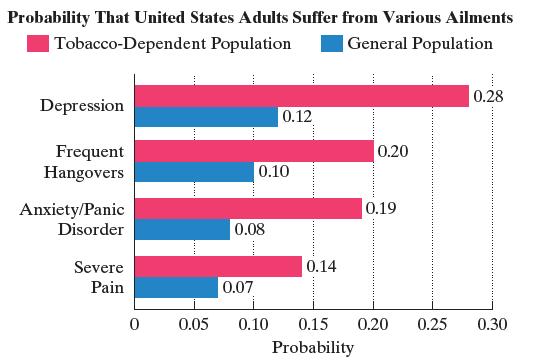
The graph shows that U.S. smokers have a greater probability of suffering from some ailments than the
Question:
The graph shows that U.S. smokers have a greater probability of suffering from some ailments than the general adult population. Exercises 57–58 are based on some of the probabilities, expressed as decimals, shown to the right of the bars. In each exercise, use a calculator to determine the probability, correct to four decimal places.
If the probability an event will occur is p and the probability it will not occur is q, then each term in the expansion of (p + q)n represents a probability.
Fantastic news! We've Found the answer you've been seeking!
Step by Step Answer:
Related Book For 

Question Posted:


