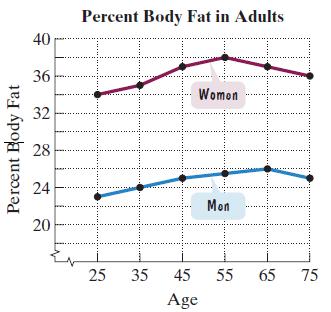
With aging, body fat increases and muscle mass declines. The line graphs show the percent body fat
Question:
With aging, body fat increases and muscle mass declines. The line graphs show the percent body fat in adult women and men as they age from 25 to 75 years. Use the graphs to solve Exercises 99–106. The function p(x) = -0.004x2 + 0.25x + 33.64 models percent body fat, p(x), where x is the number of years a person’s age exceeds 25. Use the graphs to determine whether this model describes percent body fat in women or in men.
Fantastic news! We've Found the answer you've been seeking!
Step by Step Answer:
Related Book For 

Question Posted:


