

The diagram shows a sketch of the graph with equation f(x) = 6x 2x. There is
Question:
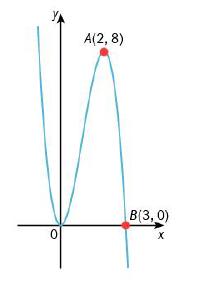
The diagram shows a sketch of the graph with equation f(x) = 6x² − 2x³. There is a minimum at the origin, a maximum at the point A(2, 8) and it cuts the x-axis at B(3, 0).
a) On separate diagrams, sketch the graphs with equations
i) y = f(2x)
ii) y = f(x + 1).
On each sketch, show where the curve cuts the x-axis and mark the coordinates of A and B.
b) The curve with equation y = f(x) + c has a maximum point at (2, 3). State the value of c.
c) The curve with equation y = df(x + e) has
a maximum point at (4, 4).
State the value of d and the value of e.
Fantastic news! We've Found the answer you've been seeking!
Step by Step Answer:
a Sketching the graphs i y f2x To sketch the graph of y f2x we substitute 2x for x in the equation f...View the full answer

Answered By
Mary Boke
I have teached the student upto class 12th as well as my fellow mates.I have a good command in engineering,maths and science.I scored 90+ marks in 10th and 12th in maths.
0 Reviews
10+ Question Solved
Related Book For 
Complete Pure Mathematics 1 For Cambridge International AS & A Level
ISBN: 9780198427438
2nd Edition
Authors: Jean Linsky, Brian Western, James Nicholson
Question Posted:
