

Question: Figure 1.26 gives hypothetical relevant chip statistics that influence the cost of several current chips. In the next few exercises, you will be exploring the
Figure 1.26 gives hypothetical relevant chip statistics that influence the cost of several current chips. In the next few exercises, you will be exploring the effect of different possible design decisions for the Intel chips.
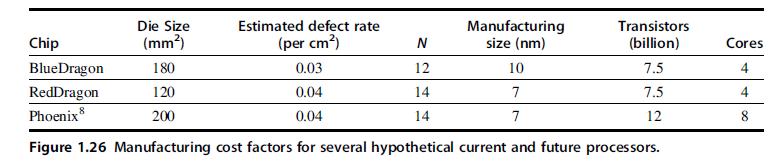
a. What is the yield for the Phoenix chip?
b. Why does Phoenix have a higher defect rate than BlueDragon?
Estimated defect rate (per cm) Chip Blue Dragon N Die Size (mm) 180 0.03 12 10 RedDragon 120 0.04 14 7 Phoenix 200 0.04 14 7 Figure 1.26 Manufacturing cost factors for several hypothetical current and future processors. Manufacturing size (nm) Transistors (billion) 7.5 7.5 12 Cores 8
Step by Step Solution
3.32 Rating (155 Votes )
There are 3 Steps involved in it
a Yield11004 24034 b It is fab... View full answer

Get step-by-step solutions from verified subject matter experts