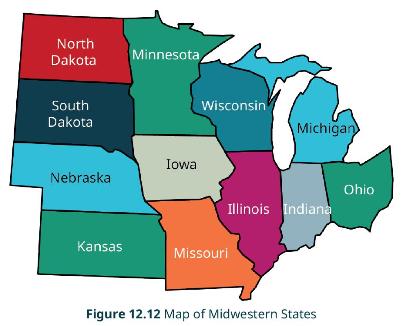
A map of the Midwest is given in Figure 12.12. Create a graph of the region in
Question:
A map of the Midwest is given in Figure 12.12. Create a graph of the region in which each vertex represents a state and each edge represents a shared border.

Transcribed Image Text:
North Dakota Minnesota South Dakota Iowa Nebraska Wisconsin Michigan Kansas Missouri Ohio Illinois Indiana Figure 12.12 Map of Midwestern States
Step by Step Answer:

This question has not been answered yet.
You can Ask your question!
Related Book For 

Question Posted:
Students also viewed these Mathematics questions
-
Mapmakers try to use as few colors as possible when coloring countries on a map, as long as no two countries that share a border have the same color. We can model this problem with an undirected...
-
MATHEMATICS FOR MACHINE LEARNING Marc Peter Deisenroth A. Aldo Faisal Cheng Soon Ong Contents Foreword 1 Part I Mathematical Foundations 9 1 Introduction and Motivation 11 1.1 Finding Words for...
-
The figure shows a map of the Island of Oahu in the State of Hawaii divided into regions. Draw a graph in which each vertex represents one of the regions and each edge represents a shared land...
-
John Hasty opened his bakery on March 1, 1999. The following transactions took place in early March: 1. Deposited $10,000 into a checking account in the name of the Hasty Bakery. 2. Leased a small...
-
Adolf Hitler, Joseph Stalin, Jim Jones, Kenneth Lay (Enron), Bernard Ebbers (WorldCom) - all were "leaders." Were they effective leaders? Why or why not?
-
What is the purpose of the Hello, World! program? The basic idea of these review questions is to give you a chance to see if you have noticed and understood the key points of the chapter. You may...
-
In a factory section, there are 80 workers and the average rate of wages per worker is Re 0.50 per hour. Standard working hours per week are 45 hours and the standard performance is 6 units per hour....
-
Burham Manufacturing Inc. sold 8,000 units and recorded sales of $400,000 for the first month of 2012. In making the sales, the company incurred the following costs and expenses. (a) Prepare a CVP...
-
Chaz Corporation has taxable income in 2 0 2 3 of $ 1 , 3 1 2 , 7 5 0 for purposes of computing the 1 7 9 expense and acquired the following assets during the year: What is the maximum total...
-
Roblox is an online gaming platform. Chloe is interested to know how many people in her network of Roblox friends are also friends with each other so she polls them. Explain how a graph or multigraph...
-
Determine the degree of each vertex of Graph J in Figure 12.7. If graph / represents direct flights between a set of airports, do any of the airports have direct flights to two or more of the other...
-
Show that the form under the integral sign is exact in the plane (Probs. 34) or in space (Probs. 59) and evaluate the integral. Show the details of your work. (6, 1) e4(2x dx + 4x2 dy) (4,0)
-
The following information about the payroll for the week ended December 30 was obtained from the records of Saine Co.: Salaries: Sales salaries Deductions: $180,000 Income tax withheld $65,296...
-
You have just been hired as the chief executive officer (CEO) in a medium-sized organization. The organization is not suffering financially, but neither is it doing as well as it could do. This is...
-
The following is the selling price and cost information about three joint products: X Y Z Anticipated production 1 2 , 0 0 0 lbs . 8 , 0 0 0 lbs . 7 , 0 0 0 lbs . Selling price / lb . at split - off...
-
calculate the maximum bending compressive stress of the following section under NEGATIVE bending moment of 216KN.m. 216mm 416mm 316mm 115mm
-
Need assistance with the following forms: 1040 Schedule 1 Schedule 2 Schedule C Schedule SE Form 4562 Form 8995 Appendix B, CP B-3 Christian Everland (SS number 412-34-5670) is single and resides at...
-
Find the following financial ratios for Smolira Golf Corp. (use year-end figures rather than average values where appropriate): Short-term solvency ratios: a. Current...
-
Dawson Companys balance sheet information at the end of 2019 and 2020 is as follows: Additional information: The company did not issue any common stock during 2020. Required : Next Level Fill in the...
-
3. The nominal interest rate compounded monthly when your $7,000 becomes $11,700 in eight years is ________
-
An investor can design a risky portfolio based on two stocks, A and B. Stock A has an expected return of 21% and a standard deviation of return of 39%. Stock B has an expected return of 14% and a...
-
Advanced Small Business Certifica Drag and Drop the highlighted items into the correct boxes depending on whether they increase or decrease Alex's stock basis. Note your answers- you'll need them for...

Study smarter with the SolutionInn App


