

Generate a histogram for undergraduate enrollment, and use it to describe the effect of the distribution on
Question:
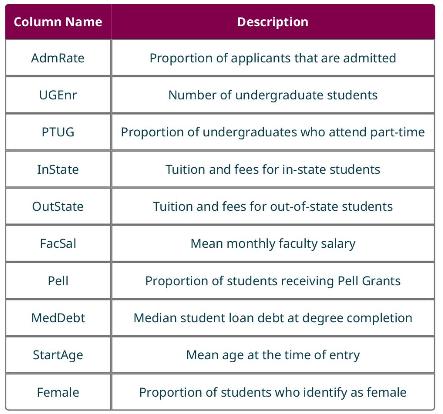
Generate a histogram for undergraduate enrollment, and use it to describe the effect of the distribution on the mean and the median as measures of centrality.
Use the data found in "TNSchools" (https://openstax.org/r/Chapter8 Data-Sets), which has data on many institutions of higher education in the state of Tennessee. Here are what the columns represent:
Fantastic news! We've Found the answer you've been seeking!
Step by Step Answer:

Answered By
Mercy Kangai
I provide creative and detailed administrative, web search, academic writing, data entry, Personal assistant, Content writing, Translation, Academic writing, editing and proofreading services. I excel at working under tight deadlines with strict expectations. I possess the self-discipline and time management skills necessary to have served as an academic writer for the past seven years. I can bring value to your business and help solve your administrative assistant issues. I have extensive experience in marketing and small business management.
27+ Reviews
86+ Question Solved
Related Book For 

Question Posted:
