

Make a pie chart to visualize these responses. A sample of students at a large university were
Question:
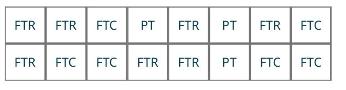
Make a pie chart to visualize these responses.
A sample of students at a large university were asked whether they were full-time students living on campus (Full-Time Residential, FTR), full-time students who commuted (FTC), or part-time students (PT). The raw data are in the table below:

Fantastic news! We've Found the answer you've been seeking!
Step by Step Answer:

Answered By
Rukhsar Ansari
I am professional Chartered accountant and hold Master degree in commerce. Number crunching is my favorite thing. I have teaching experience of various subjects both online and offline. I am online tutor on various online platform.
4+ Reviews
17+ Question Solved
Related Book For 

Question Posted:
