

The graph shown represents the graph of a function: a. True b. False -10-8-6-4-20 4 2 10
Question:
The graph shown represents the graph of a function:
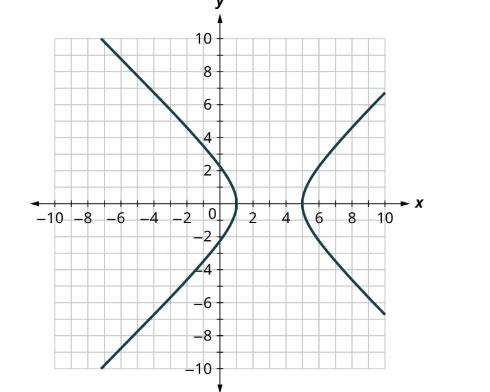
a. True
b. False
Step by Step Answer:

This question has not been answered yet.
You can Ask your question!
Related Book For 

Question Posted:
