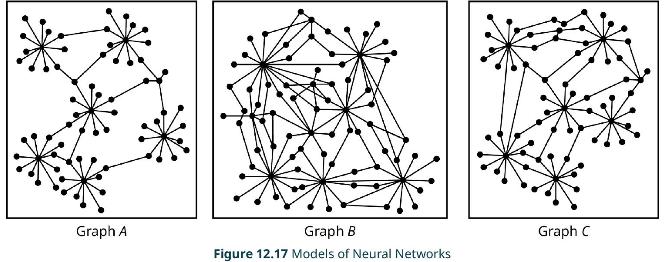
The graphs in Figure 12.17 represent neural networks, where the vertices are the nodes, and the edges
Question:
The graphs in Figure 12.17 represent neural networks, where the vertices are the nodes, and the edges represent functional connections between them. Which graph do you think would represent a network with the highest resistance to failure? Which graph would probably be the most vulnerable to failure? How might this relate to the degrees of the vertices?

Step by Step Answer:
Related Book For 

Question Posted:


