

At the beginning of 2008, Limon Company, an international telecommunications company, embarked on an environmental improvement program.
Question:
At the beginning of 2008, Limon Company, an international telecommunications company, embarked on an environmental improvement program. The company set a goal to have all its facilities ISO 14001 registered by 2011. (There are 30 facilities worldwide.) To communicate the environmental progress made, management decided to issue, on a voluntary basis, an annual environmental progress report. Internally, the Accounting Department issued monthly progress reports and developed a number of measures that could be reported even more frequently to assess progress. Limon also asked an international CPA firm to prepare an auditor’s report that would comment on the reasonableness and fairness of Limon’s approach to assessing and measuring environmental performance.
At the end of 2011, the controller had gathered data that would be used in preparing the environmental progress report. A sample of the data collected is as follows: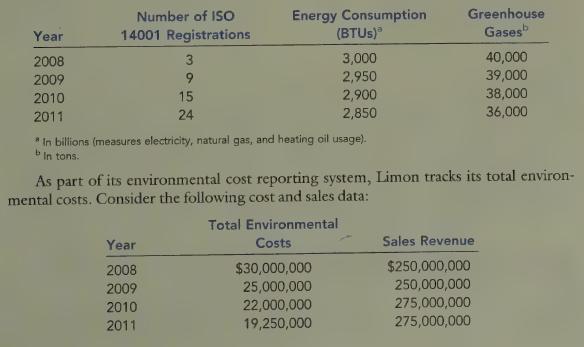
Required:
1. Using the data, prepare a bar graph for each of the three environmental variables provided (registrations, energy, and greenhouse gases). Comment on the progress made on these three dimensions.
2. Prepare a bar graph for environmental costs expressed as a percentage of sales.
Assuming that environmental performance has improved, explain why environmental costs have decreased.
3. Normalize energy consumption by expressing it as a percentage of sales. Now, prepare a bar graph for energy. Comment on the progress made in reducing energy consumption. How does this compare with the conclusion that would be reached using a nonnormalized measure of progress? Which is the best approach? Explain.LO1
Step by Step Answer:

This question has not been answered yet.
You can Ask your question!


Introduction To Cost Accounting
ISBN: 9780538749633
1st International Edition
Authors: Don R. Hansen, Maryanne Mowen, Liming Guan, Mowen/Hansen
