

Product Mix- Graphic Analysis: The graph shows the constraints of a chair manufacturing company. Each kitchen chair
Question:
Product Mix- Graphic Analysis: The graph shows the constraints of a chair manufacturing company. Each kitchen chair contributes $8 per chair; each office chair contributes $5 per chair. Only 3,000 kitchen chairs can be produced.
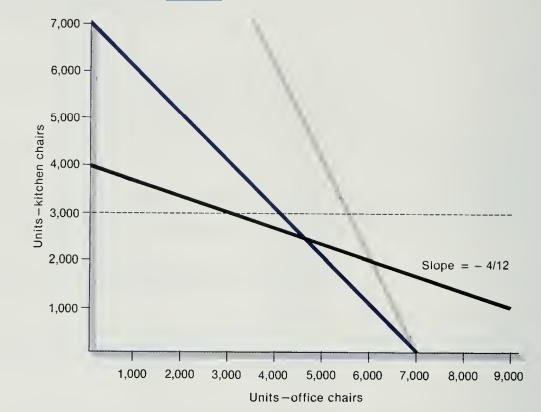
Required: What mix of chairs maximizes profits?
Step by Step Answer:

This question has not been answered yet.
You can Ask your question!
Related Book For 
Question Posted:
