

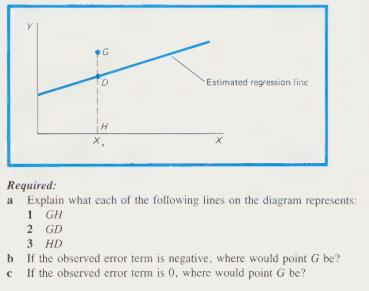
The diagram below is a scatter diagram for two variables: pg47 x. G Estimated regression line H
Question:
The diagram below is a scatter diagram for two variables: pg47
Fantastic news! We've Found the answer you've been seeking!
Step by Step Answer:

Answered By
Mugdha Sisodiya
My self Mugdha Sisodiya from Chhattisgarh India. I have completed my Bachelors degree in 2015 and My Master in Commerce degree in 2016. I am having expertise in Management, Cost and Finance Accounts. Further I have completed my Chartered Accountant and working as a Professional.
Since 2012 I am providing home tutions.
2+ Reviews
10+ Question Solved
Related Book For 
Cost Accounting Concepts And Applications For Managerial Decision Making
ISBN: 9780070103108
2nd Edition
Authors: Ralph S. Polimeni, James A. Cashin, Frank J. Fabozzi, Arthur H. Adelberg
Question Posted:
