BACKGROUND Tektronix, Inc. headquartered in Portland, Oregon, is a world leader in the production of electronic test
Question:
BACKGROUND Tektronix, Inc. headquartered in Portland, Oregon, is a world leader in the production of electronic test and measurement instruments. The company's principal product since its founding in 1946 has been the oscilloscope (scope), an instrument that measures and graphically displays electronic signals. The two divisions of the Portables Group produce and market high and medium-performance portable scopes.
Tektronix experienced almost uninterrupted growth through the 1970s based on a successful strategy of providing technical excellence in the scope market and continually improving its products in terms of both functionality and performance for the dollar. In the early 1980s, however, the lower priced end of the division's medium-performance line of scopes was challenged by an aggressive low-price strategy of several Japanese competitors. Moving in from the low-price, low-performance market segment in which Tektronix had decided not to compete, these companies set prices 25 percent below the U.S. firm's prevailing prices. Rather than moving up the scale to more highly differentiated products, the group management decided to block the move.
The first step was to reduce the prices of higher-perfonnance, higher-cost scopes to the prices of the competitors' scopes of lower performance. This short-term strategy resulted in reported losses for those instruments. The second step was to put in place a new management team whose objective was to turn the business around. These managers concluded that, contrary to conventional wisdom, the Portables Group divisions could compete successfully vwth foreign competition on a cost basis. To do so, the divisions would have to reduce costs and increase customer value by increasing operational efficiency.
PRODUCTION PROCESS CHANGES The production process in the Portables Group divisions consisted of many functional islands, including etched circuit board (ECB) insertion, ECB assembly, ECB testing, ECB repair, final assembly, test, thermal cycle, test/QC, cabinet fitting, finishing, boxing for shipment, and shipment. The new management team consolidated these functionallyoriented activities into integrated production lines in open work spaces that allow visual control of the entire production area. Parts inventory areas were also placed parallel to production lines so that at each work station operators would be able to pull their own parts.
This in essence created an early warning system that nearly eliminated line stoppages due to stockouts.
Additional steps that were taken in the early to mid 1980s to solve managerial and technical problems include implementation of just-in-time (JIT) delivery and scheduling techniques and total quality control (TQC), movement of manufacturing support departments into the production area, and implementation of people involvement (PI)
techniques to move responsibility for problem solving down to the operating level of the divisions. The results of these changes were impressive: substantial reductions in cycle time, direct labor hours per unit, and inventory, and increases in output dollars per person per day and operating income. The cost accounting group had dutifully measured these improvements, but had not effectively supported the strategic direction of the divisions.
COST ACCOUNTING SYSTEM DIRECT MATERIALS AND DIRECT LABOR The total manufacturing cost of the newest portable scopes produced with the latest technologies has 75% direct materials, 3% direct labor, and 22% factory overhead. In most cases, direct materials and direct labor are easily traced to specific products for costing purposes. Prior to the mid 1980s, however, the divisions' attempts to control direct labor had been a resource drain that actually decreased productivity. There were approximately twenty-five production cost centers in the Portable Instruments Plant. Very detailed labor efficiency reports were prepared monthly for each cost center and each major step in the production process. In addition, an efficiency rating for each individual employee was computed daily. Employees reported the quantity of units produced and the time required to produce them, often overestimating the quantity produced to show improved efficiency against continually updated standards. The poor quality of collected data resulted in semi-annual inventory-downs when physical and book quantities were compared.
"The inadequacy of our efficiency reporting system became clear when we analyzed one of our new JIT production lines," commented Michael Wright, Financial Systems Application Manager. "On a JIT manufacturing line, once the excess inventory has been flushed out, it is essentially impossible for any person to work faster or slower than the line moves. However, if one person on the line is having a problem, it immediately becomes apparent because the product flow on the line stops. Corrective action is then taken, and the line is started up again.
"On that line, the system told us that the efficiency of each of the workers was decreasing. However, stepping back from the detail of the situation allowed us to look at the overall picture. We found that the costs incurred on the line were going dowri and its product output was going up. Obviously, it was becoming more, not less, efficient."
The quantity of direct labor data collected and processed also was a problem.
Production employees often spent twenty minutes per day completing required reports when they could have been producing output. Additionally, the accounting staff was processing 35,000 labor transactions per month to account for what amounted to 3 percent of total manufacturing cost.
"Transactions cost money," observed John Jonez, Group Cost Accounting Manager,
"and lots of transactions cost lots of money."
In response to these problems, the group accounting staff greatly simplified its procedures. It abandoned the measurement of labor performance for each operation, and greatly reduced the number of variances reported. The number of monthly labor transactions fell to less than 70, allowing the staff to spend more time on factory overtiead allocation and other pressing issues.
FACTORY OVERHEAD The product costing system allocated all factory overhead costs to products based on standard direct labor hours. A separate rate was computed for each manufacturing cost center. This system led to rapidly increasing rates: the direct labor content of the group's products had been continually decreasing for years, while factory overhead costs were increasing in absolute terms.
"Because the costing system con-elated overtiead to labor, our engineers concluded that the way to reduce overhead costs was to reduce labor," commented Jonez. "The focus of cost reduction programs therefore had been the elimination of direct labor. However, most of this effort was misdirected, because there was almost no correlation between overhead cost incurrence and direct labor hours worked. Our system penalized products with proportionately higher direct labor, but it wasn't those products that caused overhead costs.
We proved that. We attacked direct labor and it went down, but at the same time overhead went up.
"We therefore knew that we needed a new way to allocate overhead. More fundamentally, we needed a way for the cost accounting system to support the manufacturing strategy of our group. The objective was clear-to provide management with accounting information that would be useful in identifying cost reduction opportunities in its operating decisions as well as provide a basis for effective reporting of accomplishments."
APPROACH TO METHOD CHANGE Initial Steps The first step taken by Wright and Jonez in developing a new overhead allocation method was to establish a set of desirable characteristics for the method. They decided that it must accurately assign costs to products, thus providing better support for management decisions than the old method. It must support the JIT manufacturing strategy of the Portables Group.
It also must be intuitively logical and easily understandable by management. And finally, it must provide information that is accessible by decision makers.
The next step was to inten/iewthe engineering and manufacturing managers who were the primary users of product cost information. These users were asked, "What is it that makes your job more difficult? What is it that makes certain products more difficult to manufacture? What causes the production line to slow down? What is it that causes overhead?" The answers to these questions were remarkably consistent-there were too many unique part numbers in the system. This finding revealed a major flaw in the ability of the direct labor-based costing method to communicate information critical for cost-related decisions. Manufacturing managers realized there were substantial cost reduction opportunities through the standardization of component parts, but there was no direct method to communicate this idea to design and cost-reduction engineers who made part selection decisions.
Although difficult to quantify, some costs are associated with just carrying a part number in the database. Each part number must be originally set up in the system, built into the structure of a bill of materials, and maintained until it is no longer used. Moreover, each part must be planned, scheduled, negotiated with vendors, purchased, received, stored, moved, and paid for. Having two parts similar enough that one could be used for both applications requires unnecessary duplication of these activities, and therefore unnecessary costs.
Standardizing parts results in several indirect benefits. Fewer unique part numbers usually means fewer vendors and greater quality of delivered parts. It also means smoother JIT production, fewer shutdowns of manufacturing lines, and greater field reliability. These observations led to a preliminary consensus on the need to develop a product costing method that would quantify and communicate the value of parts standardization.
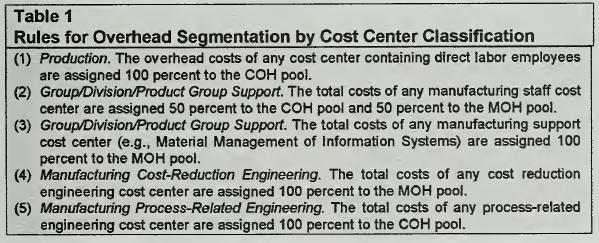
COST ANALYSIS "To confirm our assessment," stated Jonez, "we segmented the total manufacturing overhead cost pool. The costs of all cost centers comprising the pool were categorized as either materials-related or conversion-related based upon rules developed in conjunction with operating managers. (See T-1)
"Material-related costs pertain to procurement, scheduling, receiving, incoming inspection, stockroom personnel, cost-reduction engineering, and information systems.
Conversion-related costs are associated with direct labor, manufacturing supervision, and process-related engineering. Application of the rules resulted in an approximately 55/45 split between materials overtiead (MOH) and conversion overhead (COH). This finding further confirmed the inadequacy of the existing method, which applied all overhead based on direct labor."
The accounting analysts decided to focus their initial efforts on the MOH pool. To improve their understanding of the composition of the pool and thus assist them in developing a method for its allocation, Wright and Jonez consulted operating managers and further segmented it into:
1 .
Costs due to the value of parts, 2. Costs due to the absolute number of parts used, 3. Costs due to the maintenance and handling of each different part number and 4. Costs due to each use of a different part number.
The managers believed that the majority of MOH costs were of type (3). The costs due to the value of parts (1) and the frequency of the use of parts (2 and 4) categories were considered quite small by comparison.
The analysts therefore concluded that the material-related costs of the Portables Group would decrease if a smaller number of different part numbers were used in its products. This cost reduction would result from two factors. First, greater volume discounts would be realized by purchasing larger volumes of fewer unique parts. Second, material overhead costs would be lower. "It was the latter point that we wanted our new allocation method to focus on," commented Wright.
"Our goal," continued Jonez, "was to increase customer value by reducing overhead costs. Our strategy was parts standardization. We needed a tactic to operationalize the strategy."
(IMA Case)
REQUIRED:
1 Using assumed numbers, develop a cost allocation method for materials overhead (MOH) to quantify and communicate the strategy of parts standardization.
2. Explain how use of your method would support the strategy.
3. Is any method which applies the entire MOH cost pool on the basis of one cost driver sufficiently accurate for product decisions in the highly competitive portable scope markets? Explain.
4. Are MOH product costing rates developed for management reporting appropriate for inventory valuation for external reporting? Why or why not?
Step by Step Answer:

Cost Management A Strategic Emphasis
ISBN: 9780070059160
1st Edition
Authors: Edward Blocher, Kung Chen, Thomas Lin


