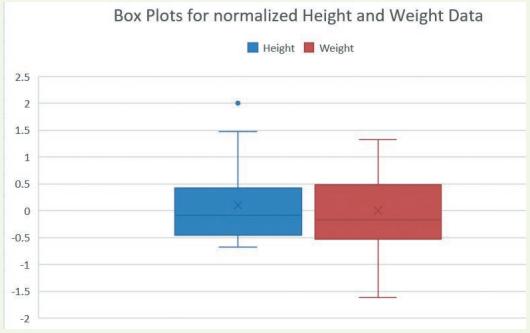
(LO 10-3) The following box plots illustrate the heights (blue/left) and weights (red/right) from a sample of...
Question:
(LO 10-3) The following box plots illustrate the heights (blue/left) and weights (red/right)
from a sample of children. To make it easier to compare the two box plots, the heights and weights of each individual have been transformed to a z-variable, which is a method for transforming datasets so that the data are set on the same scale.

a. Does either of the box plots have outliers? If so, which one? Is the outlier positive or negative?
b. If there is an outlier and we assume that it is not an error in the dataset, what does the outlier imply about the individual in comparison to the rest of the individuals sampled?
c. Which set of data, height or weight, has wider variability (excluding any outliers)?
d. There is a slight skew to the data for weight. In which direction does it slightly skew?
How can you tell?
Step by Step Answer:

Introduction To Data Analytics For Accounting
ISBN: 9781266358234
2nd Edition
Authors: Vernon Richardson, Katie Terrell And Ryan Teeter


