

(LO 6-3, LO 6-4) Use the following data to graph the sales revenue and net income for...
Question:
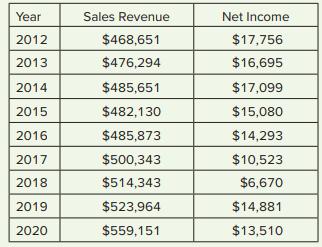
(LO 6-3, LO 6-4) Use the following data to graph the sales revenue and net income for Walmart from 2012–2020 in Excel. Create a bar graph for sales revenue, and create a line graph for net income, formatting the x- and y-axes with year and numbers inserting appropriate chart titles. What trends do you see for Walmart sales and Walmart net income over this time period? The data file, Walmart Trend Analysis.xls, is available in Connect or via the Additional Student Resources page. (Note the data is in $ millions.)
Step by Step Answer:

This question has not been answered yet.
You can Ask your question!
Related Book For 
Introduction To Data Analytics For Accounting
ISBN: 9781266358234
2nd Edition
Authors: Vernon Richardson, Katie Terrell And Ryan Teeter
Question Posted:
