

(LO 9-6) This exhibit provides an example of a sensitivity analysis that might be performed by management...
Question:
(LO 9-6) This exhibit provides an example of a sensitivity analysis that might be performed by management accountants, evaluating the changing profitability based on two important inputs, the level of total fixed costs, and the sales price.
To perform sensitivity analysis, the analysis varies the sales price from $35 to $53 (as shown in the columns) and the fixed costs from $500 to $3,000 (as shown in the rows).
The colored columns are the total profits based on the changing input parameters. When combined with conditional formatting, the estimated profitability can be evaluated.
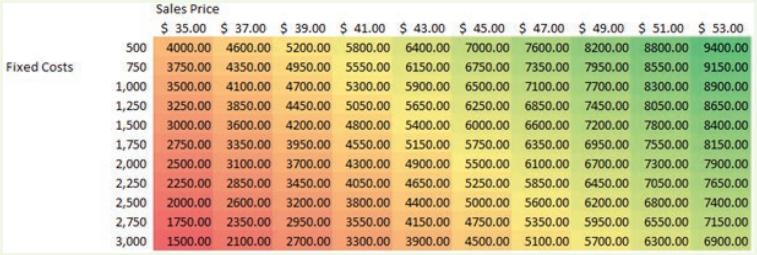
Required 1. As sales price increases, what happens to the estimated profitability?
2. As total fixed costs increase, what happens to the estimated profitability?
3. If the sales price is $53 and total fixed costs are $3,000, what is the estimated profitability?
4. If the sales price is $45 and total fixed costs are $500, what is the estimated profitability?
5. Which is more impactful on profitability, a $2 increase in sales price or a $250 decrease in total fixed costs?
6. How does conditional formatting help you to visualize the impact of these two important inputs on estimated profitability?
Step by Step Answer:


Introduction To Data Analytics For Accounting
ISBN: 9781266358234
2nd Edition
Authors: Vernon Richardson, Katie Terrell And Ryan Teeter
