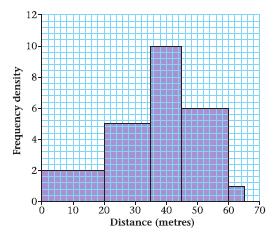
A Fun Day committee at a local sports centre organised a throwing the cricket ball competition. The
Question:
A Fun Day committee at a local sports centre organised a throwing the cricket ball competition. The distance thrown by every competitor was recorded. The data were collected and are shown in the histogram. The number of competitors who threw less than 10 m was 40. a Why is a histogram a suitable diagram to represent these data? b How many people entered the competition? c Estimate how many people threw between 30 and 40 metres. d How many people threw between 45 and 65 metres?
e Estimate how many people threw less than 25 metres.AppendixLO1

Fantastic news! We've Found the answer you've been seeking!
Step by Step Answer:
Related Book For 

Edexcel As And A Level Modular Mathematics Statistics 1
ISBN: 978-0435519124
1st Edition
Authors: Keith Pledger Et Al
Question Posted:


