Since states with larger numbers of elderly residents would naturally have more nursing home residents, the number
Question:
Since states with larger numbers of elderly residents would naturally have more nursing home residents, the number of nursing home residents in a state is often adjusted for the number of people 65 years of age or order (65+). That adjustment is usually given as the number of nursing home residents age 65+ per 1,000 members of the population age 65+. For example, a hypothetical state with 200 nursing home residents age 65+ and 50,000 people age 65+ would have the same adjusted number of residents as a state with 400 residents and a total age 65+ population of 100,000 residents: 4 residents per 1,000.
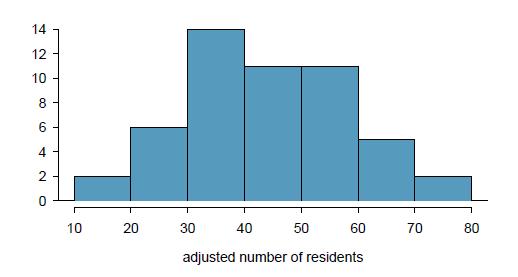
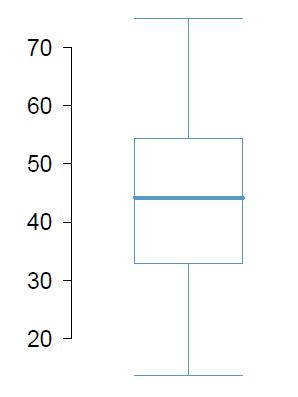
Use the two plots below to answer the following questions. Both plots show the distribution of the number of nursing home residents per 1,000 members of the population 65+ (in each state).


(a) Is the distribution of adjusted number of nursing home residents symmetric or skewed? Are there any states that could be considered outliers?
(b) Which plot is more informative: the histogram or the boxplot? Explain your answer.
(c) What factors might influence the substantial amount of variability among different states? This question cannot be answered from the data; speculate using what you know about the demographics of the United States.
Step by Step Answer:

Introductory Statistics For The Life And Biomedical Sciences
ISBN: 9781943450121
1st Edition
Authors: Julie Vu, David Harrington


