The following stem and leaf diagram summarises the wing length, to the nearest mm, of a random
Question:
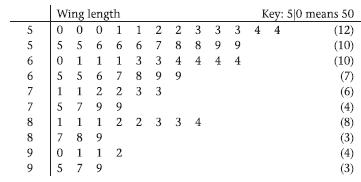
The following stem and leaf diagram summarises the wing length, to the nearest mm, of a random sample of 67 owl moths.
a Write down the mode of these data. b Find the median and quartiles of these data. c On graph paper, construct a box plot to represent these data. d Comment on the skewness of the distribution. e Calculate the mean and standard deviation of these data. f Use a further method to show that these data are skewed. g State, giving a reason, which of bore you would recommend using to summarise the data in the table.AppendixLO1
Step by Step Answer:
Related Book For 

Edexcel As And A Level Modular Mathematics Statistics 1
ISBN: 978-0435519124
1st Edition
Authors: Keith Pledger Et Al
Question Posted:


