

Question: Consider the temperature control system of Problem 6.2-4 and Fig. P6.2-4. (a) Let T = 6 s , and solve for the response to the
Consider the temperature control system of Problem 6.2-4 and Fig. P6.2-4.
(a) Let T = 6 s , and solve for the response to the input R(s) = 0.4 s−1 . Plot this response on the same graph with the response found in Problem 6.2-4. Note the effects of increasing T from 0.6 s to 6 s, when the plant has a time constant of 2 s.
(b) Find c(t) for 0 ≤ t ≤ 6 s. This response can be calculated without the use of the z-transform.
Problem 6.2-4
Shown in Fig. P6.2-4 is the block diagram of a temperature control system for a large test chamber. This
system is described in Problem 1.6-1. Ignore the disturbance input for this problem.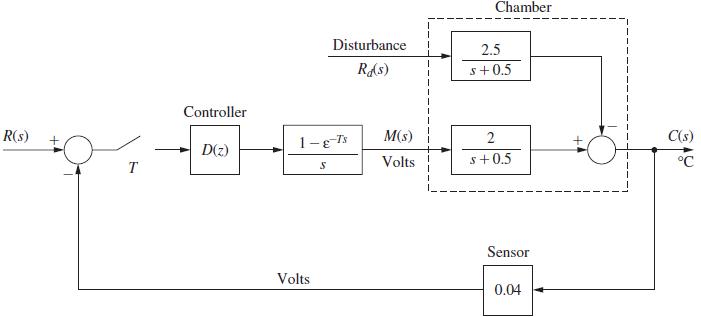
R(s) T Controller D(z) 1-E-Ts Volts Disturbance Rd(s) S M(s) Volts 1 Chamber 2.5 s+0.5 2 s+0.5 Sensor 0.04 C(s) C
Step by Step Solution
3.52 Rating (152 Votes )
There are 3 Steps involved in it
1 a Gz 2 5 5 5 05 51 2 ss05 Tz Cz 04z 3801 1379z z1 Z01022 z1 cKT... View full answer

Get step-by-step solutions from verified subject matter experts