

Question: Figure 2.22 shows a similar study to that in Task 9, but the means were 10 (singing) and 10.01 (conversation), the standard deviations in both
Figure 2.22 shows a similar study to that in Task 9, but the means were 10 (singing) and 10.01 (conversation), the standard deviations in both groups were 3 and each group contained 1 million people. Compute the values of the confidence intervals displayed in the figure.
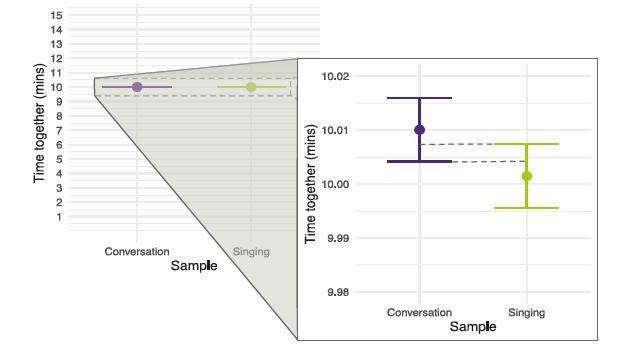
Time together (mins) 5 4 3 2 1 15 14 13 12 11 10 Conversation Singing Sample Time together (mins) 10.02 10.01 10.00 9.99 9.98 Conversation Sample Singing
Step by Step Solution
★★★★★
3.48 Rating (148 Votes )
There are 3 Steps involved in it
1 Expert Approved Answer
Step: 1 Unlock

Question Has Been Solved by an Expert!
Get step-by-step solutions from verified subject matter experts
Step: 2 Unlock
Step: 3 Unlock