Question: Using the shopping.sav data from Chapter 4 (Task 5), plot two error bar charts comparing men and women (x-axis): one for the distance walked, and
Using the shopping.sav data from Chapter 4 (Task 5), plot two error bar charts comparing men and women (x-axis): one for the distance walked, and the other for the time spent shopping.
Chapter 4 Task 5
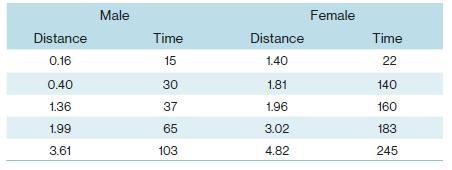
According to some highly unscientific research done by a UK department store chain and reported in Marie Claire magazine (https://tinyurl.com/mcsgh), shopping is good for you. They found that the average woman spends 150 minutes and walks 2.6 miles when she shops, burning off around 385 calories. In contrast, men spend only about 50 minutes shopping, covering 1.5 miles. This was based on strapping a pedometer on a mere 10 participants. Although I don’t have the actual data, some simulated data based on these means are below. Enter these data into SPSS and save them as shopping.sav.

Male Female Distance Time Distance Time 0.16 15 1.40 22 0.40 30 1.81 140 1.36 37 1.96 160 1.99 65 3.02 183 3.61 103 4.82 245
Step by Step Solution
There are 3 Steps involved in it

Get step-by-step solutions from verified subject matter experts


