Estimating Qualcomm stock prices. As an example of the polynomial regression, consider data on the weekly stock
Question:
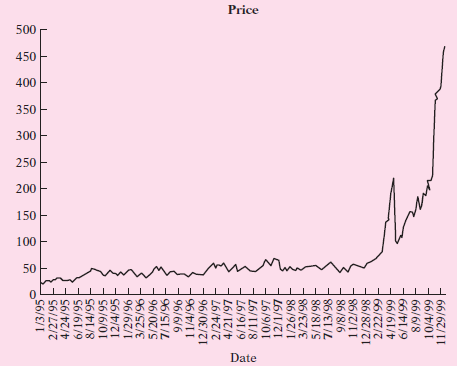
During the late 1990, technological stocks were particularly profitable, but what type of regression model will best fit these data? Following figure shows a basic plot of the data for those years.
This plot does seem to resemble an elongated S curve; there seems to be a slight increase in the average stock price, but then the rate increases dramatically toward the far right side of the graph. As the demand for more specialized phones dramatically increased and the technology boom got under way, the stock price followed suit and increased at a much faster rate.
a. Estimate a linear model to predict the closing stock price based on time. Does this model seem to fit the data well?
b. Now estimate a squared model by using both time and time-squared. Is this a better fit than in (a)?
c. Finally, fit the following cubic or third-degree polynomial:
Yi = β0 + β1Xi + β2X2i + β3X3i + ui
where Y = stock price and X = time. Which model seems to be the best estimator for the stock prices?
StocksStocks or shares are generally equity instruments that provide the largest source of raising funds in any public or private listed company's. The instruments are issued on a stock exchange from where a large number of general public who are willing...
Step by Step Answer:


