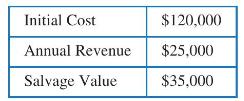
Plot a sensitivity graph for annual worth versus initial cost, annual revenue, and salvage value for the
Question:
Plot a sensitivity graph for annual worth versus initial cost, annual revenue, and salvage value for the data in the table below. Vary only one parameter at a time, each within the range of -20 percent to +20 percent. MARR is 3 percent/year. Project life is 4 years. Based on your graph, which parameter shows the most sensitivity? The least?

Step by Step Answer:
Related Book For 

Principles Of Engineering Economic Analysis
ISBN: 9781118163832
6th Edition
Authors: John A. White, Kenneth E. Case, David B. Pratt
Question Posted:


